Meeting minutes from the 2014 Annual General Meeting held May 21, 2015.
ESPC Documents/GOVERNANCE/A.02.B Annual Report/2014_AGM_Minutes_20150521.pdf
Meeting minutes from the 2014 Annual General Meeting held May 21, 2015.
ESPC Documents/GOVERNANCE/A.02.B Annual Report/2014_AGM_Minutes_20150521.pdf

ESPC Documents/RESEARCH UPDATES AND REVIEWS/December 2015 – Issues in Canadian Public Policy.pdf
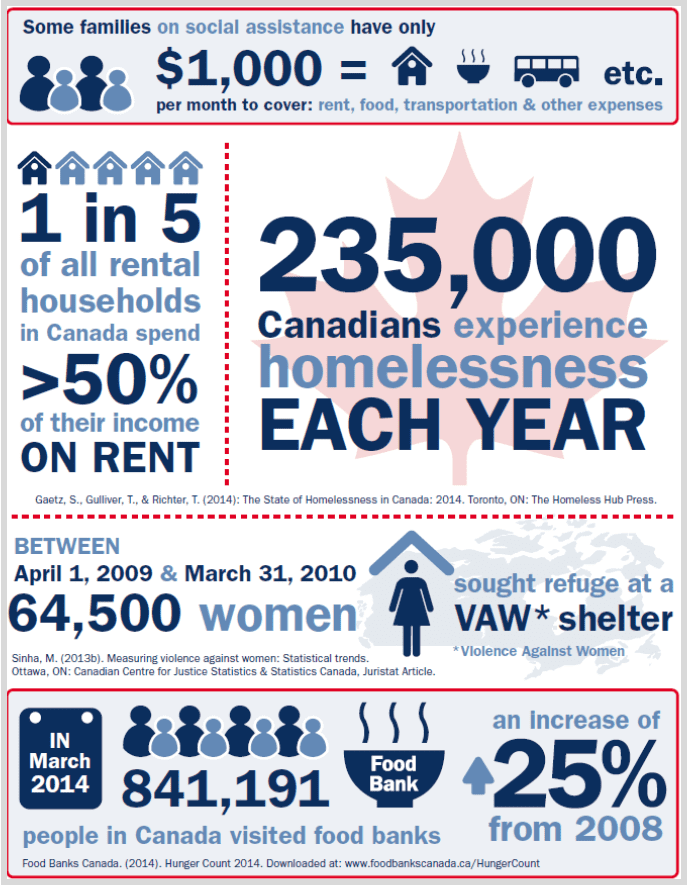
ESPC releases updated publication tracking trends – Click here to download – 2015 ESPC Tracking the Trends
The Edmonton Social Planning Council (ESPC) today released the 2015 edition of its flagship publication Tracking the Trends. The 128-page publication provides a detailed analysis of social and economic trends in Edmonton. Information is provided about population demographics, education and employment, living costs & housing, income & wealth, and poverty trends that together comprise the social health of Edmontonians.
“Whether planning programs or developing policies, timely accurate information is critical to informed decision-making,” said John Kolkman, the ESPC’s Research Coordinator. “Tracking the Trends is a one-stop resource for identifying and analyzing a broad range of social and economic trends impacting those with low and modest incomes in our community,” he added.
“An overarching message in this year’s Tracking the Trends is that – following several years of strong employment and income growth – Edmonton is entering a period of increased uncertainty due to a collapse in oil and natural gas prices. The impact of this change is starting to show up in some of the trends we follow,” noted Kolkman.
Kolkman highlighted several key Edmonton trends reflecting this uncertainty:
Tracking the Trends 2015 also identifies a number of concerning trends:
Kolkman said the report also finds many positive trends:
Tracking the Trends 2015 combines 22 key indicators grouped into 5 categories into a Social Health Index (pp. 106-111). Categories where Edmonton does well are financial security and personal & family stability. Edmonton is doing more poorly on population health and participation & environmental indicators.
“The bottom line is a 20.1% improvement in Edmonton’s social health since the year 2000. During this time period, Edmonton’s social health improved at a more rapid rate than the 14.5% growth in Alberta GDP per person,” Kolkman concluded.
The Edmonton Social Planning Council (ESPC) today released the 2015 edition of its flagship publication Tracking the Trends. The 128-page publication provides a detailed analysis of social and economic trends in Edmonton. Information is provided about population demographics, education and employment, living costs & housing, income & wealth, and poverty trends that together comprise the social health of Edmontonians.
“Whether planning programs or developing policies, timely accurate information is critical to informed decision-making,” said John Kolkman, the ESPC’s Research Coordinator. “Tracking the Trends is a one-stop resource for identifying and analyzing a broad range of social and economic trends impacting those with low and modest incomes in our community,” he added.
“An overarching message in this year’s Tracking the Trends is that—following several years of strong employment and income growth—Edmonton is entering a period of increased uncertainty due to a collapse in oil and natural gas prices. The impact of this change is starting to show up in some of the trends we follow,” noted Kolkman.
Kolkman highlighted several key Edmonton trends reflecting this uncertainty:
Tracking the Trends 2015 also identifies a number of concerning trends:
Kolkman said the report also finds many positive trends:
Tracking the Trends 2015 combines 22 key indicators grouped into 5 categories into a Social Health Index (pp. 106-111). Categories where Edmonton does well are financial security and personal & family stability. Edmonton is doing more poorly on population health and participation & environmental indicators.
“The bottom line is a 20.1% improvement in Edmonton’s social health since the year 2000. During this time period, Edmonton’s social health improved at a more rapid rate than the 14.5% growth in Alberta GDP per person,” Kolkman concluded.
ESPC Documents/PUBLICATIONS/A.06.F TRACKING THE TRENDS/Tracking the TRENDS 2015 FINAL.pdf
Budget 2015 covers the period from April 1, 2015 to March 31, 2016 corresponding to the 2015-16 fiscal year (FY). Due to the change in government on May 5, this budget replaces the March 2015 budget that was tabled but never passed by the previous government. In this Fact Sheet, Budget 2015 refers to the current budget introduced on October 27, 2015.
Budget 2015 forecasts a deficit of $6.1 billion, an increase of $1.1 billion from March. The larger deficit is due to several factors: reversing Conservative cuts to people services to cover inflation and population growth, a further drop in energy prices below levels forecast in March, and additional costs for forest fires and crop losses due to the summer drought. While the forecast deficit is a record in dollar terms, as a percentage of the overall budget, it is less than half that of budgets in the mid-1980s when there was a similar dramatic decline in energy prices.
Click to download: 2015 Alberta Budget Analysis
Budget 2015 covers the period from April 1, 2015 to March 31, 2016 corresponding to the 2015-16 fiscal year (FY). Due to the change in government on May 5, this budget replaces the March 2015 budget that was tabled but never passed by the previous government. In this Fact Sheet, Budget 2015 refers to the current budget introduced on October 27, 2015.
Budget 2015 forecasts a deficit of $6.1 billion, an increase of $1.1 billion from March. The larger deficit is due to several factors: reversing Conservative cuts to people services to cover inflation and population growth, a further drop in energy prices below levels forecast in March, and additional costs for forest fires and crop losses due to the summer drought. While the forecast deficit is a record in dollar terms, as a percentage of the overall budget, it is less than half that of budgets in the mid-1980s when there was a similar dramatic decline in energy prices.
ESPC Documents/Fact Sheets/Fact_Sheet_Alberta_Budget_2015.pdf